When firms issue
bonds, in theory they can be of any maturity. In practice they tend to
be of longer maturities than, say, bank debt, although this is not always
true. To give you an example, we have created the distribution of debt
maturities for all bond issues (in SDC) from non-financial, non-governmental
issuers (i.e. we excluded SIC codes 6000, 8200 and 9000) which were issued
(sold) between 1986 and 2000. There were 9,204 issuances. The years to
maturity have been rounded to the nearest quarter.
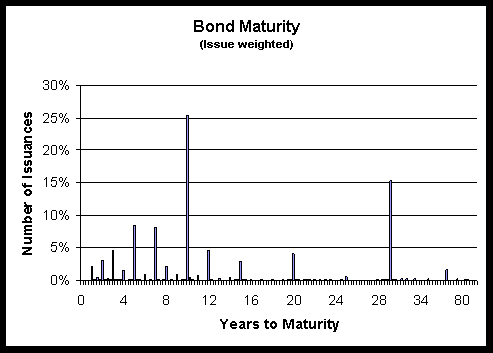
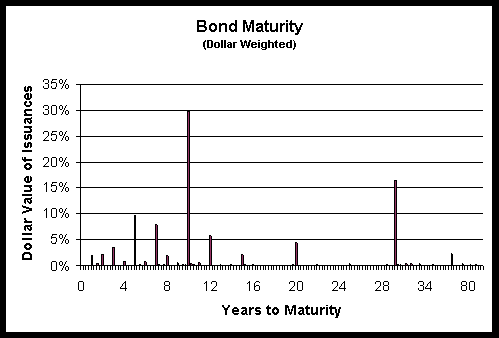
The average maturity is about 14 years
(13.9 if we weight the issues equally, 14.6 if we weight by dollars). As
you can see from Figure 1 (Bond Maturity (issue weighted)) and Figure 2
(Bond Maturity (dollar weighted)), the size of the issue is not correlated
with the maturity.
Figure 1:

Figure 2:

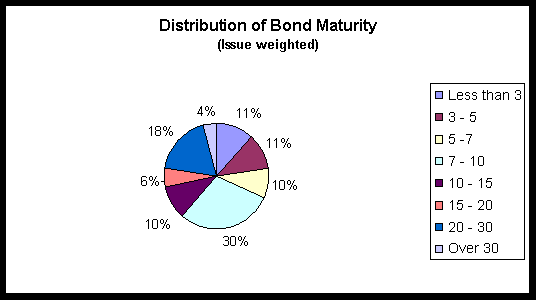
In Figure 3, we have the same data as
Figure 1, but presented as a pie chart. The ranges include the upper limit,
but not the lower limit. Thus the range 3-5 years is bond issues which
are greater than three years but less than or equal to 5 years. There are
bonds with short maturities, but these are a small fraction of the sample.
7 percent of the issues have maturities of less than 3 years and 14% of
less than 5 years. 4 percent of the issues have maturities over 30 years
with the longest maturity being 101 years. The ranges
Figure 3:

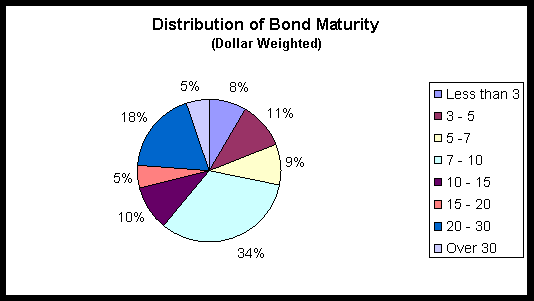
Figure 4:
